Marketing Campaign
Performance Dashboard #VOTD
Visualization by: Gbolahan Adebayo
Date: May, 2023
Type: Business Dashboard
Link to Visualization: Click Here
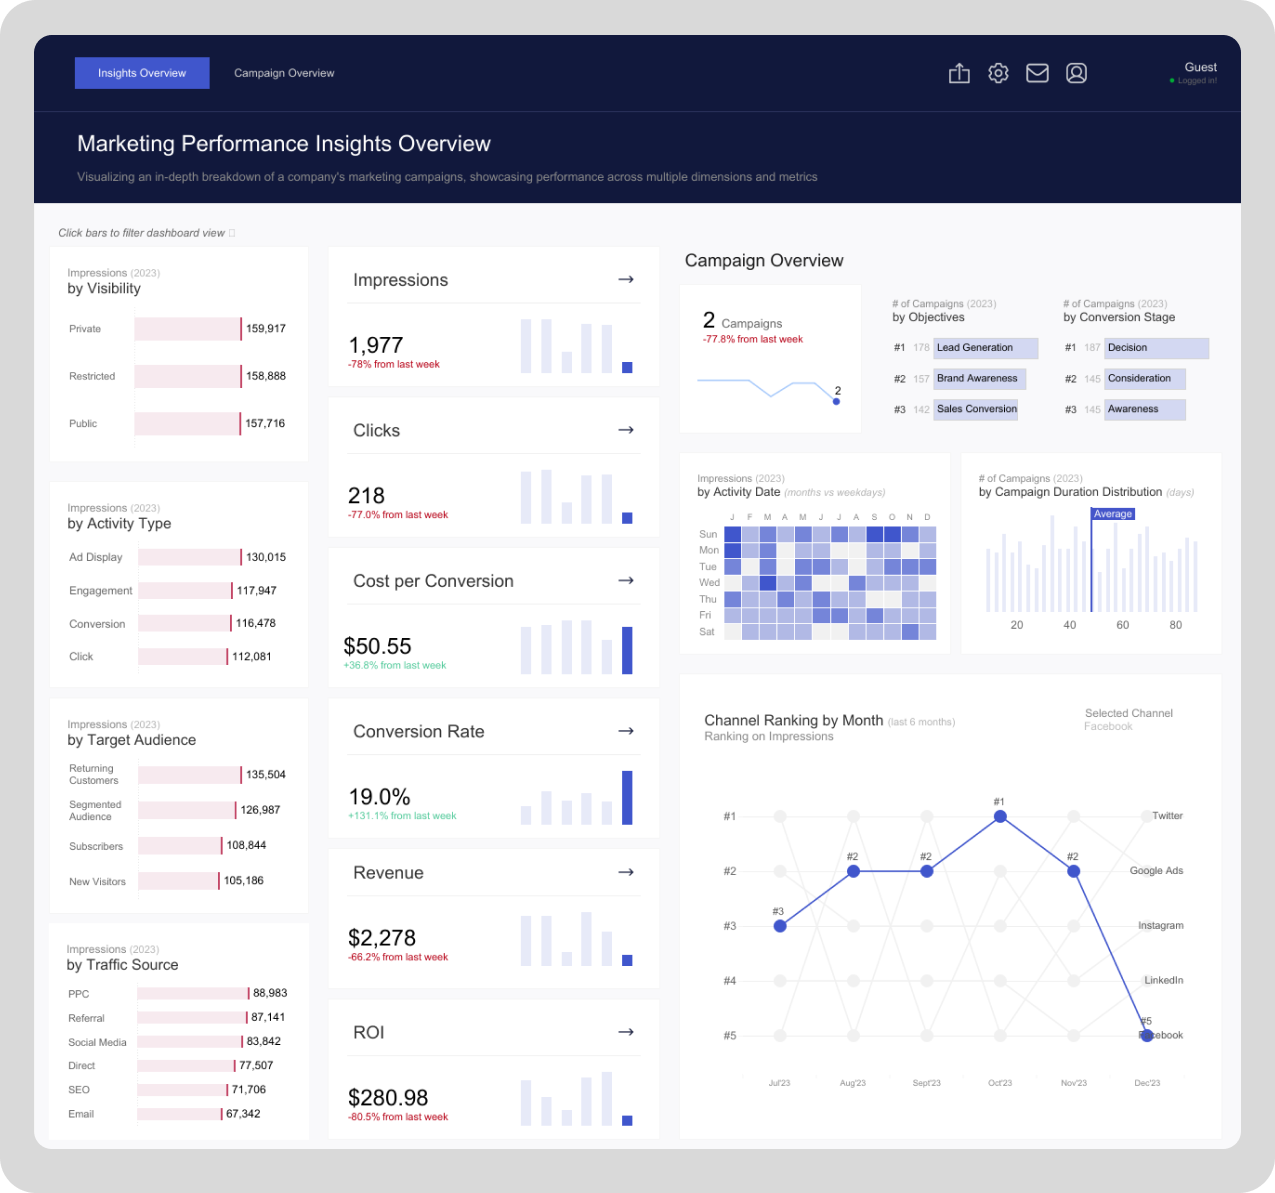
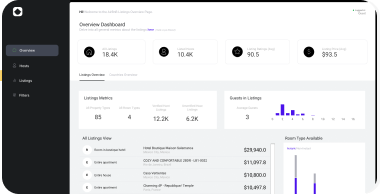
The “Marketing Performance Insights Overview” dashboard provides a detailed analysis of a company’s marketing campaigns, showcasing performance metrics across various dimensions. At a glance, key metrics such as impressions (1,977), clicks (218), cost per conversion ($50.55), conversion rate (19%), revenue ($2,278), and ROI ($280.98) are highlighted with percentage changes from the previous week, offering insights into week-over-week trends. Supporting these KPIs are bar charts and sparklines that visualize changes over time for better trend analysis.
The left panel categorizes impressions by various factors, such as visibility (e.g., private, restricted, public), activity type (e.g., ad display, engagement, conversion, click), target audience (e.g., returning customers, segmented audiences, new visitors), and traffic sources (e.g., PPC, referral, social media). This breakdown allows stakeholders to identify which segments are driving the most engagement. On the right, the Campaign Overview provides a high-level summary of the current campaigns, including the number of campaigns (2), their objectives (e.g., lead generation, brand awareness), and their stages in the conversion funnel (e.g., decision, consideration, awareness). Additional visualizations include a heatmap showing impressions by activity date, a distribution chart for campaign durations, and a channel ranking line chart. The line chart compares impressions over the past six months across channels like Twitter, Google Ads, Instagram, LinkedIn, and Facebook, highlighting their performance trends.
Overall, this dashboard enables marketing teams to monitor campaign performance, identify areas of success, and pinpoint opportunities for improvement across various channels and audience segments. Its intuitive design, with segmented breakdowns and trend-focused visualizations, ensures actionable insights for decision-making.
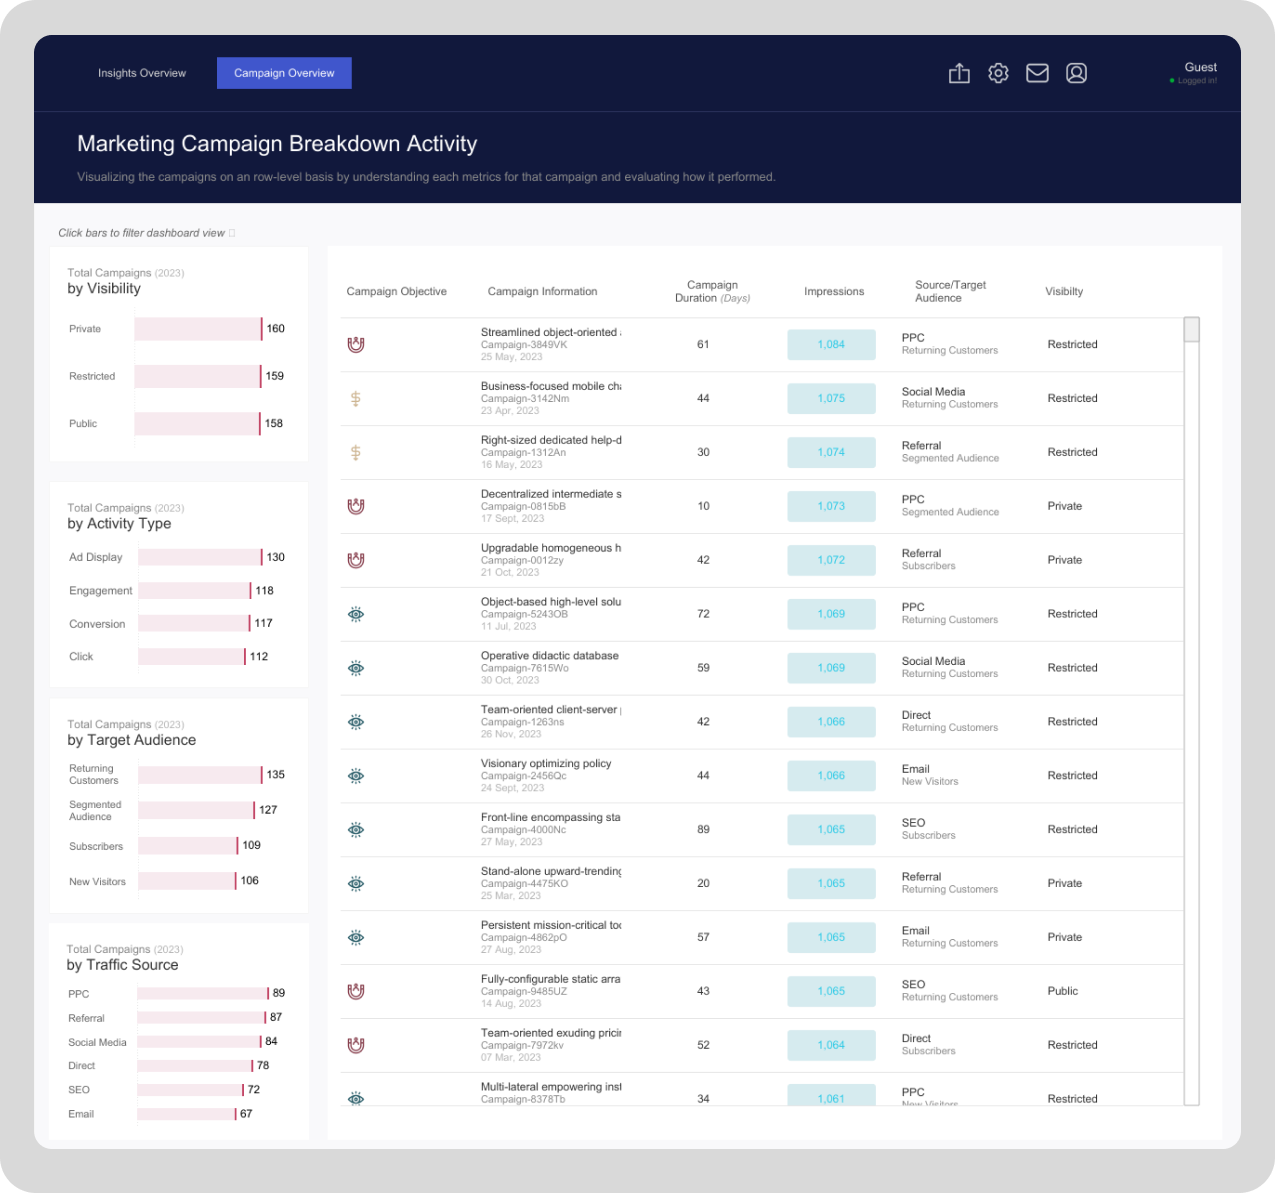
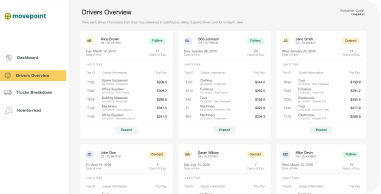
The “Marketing Campaign Breakdown Activity” dashboard provides a comprehensive view of individual marketing campaigns, enabling stakeholders to analyze their performance across multiple dimensions. On the left side, bar charts categorize campaigns by visibility (e.g., private, restricted, public), activity type (e.g., ad display, engagement, conversion, click), target audience (e.g., returning customers, segmented audiences, new visitors), and traffic sources (e.g., PPC, referral, social media). These visualizations offer a quick overview of how campaigns are distributed, helping identify trends and areas of focus.
The main section of the dashboard presents a detailed table showcasing each campaign’s specific metrics. For every campaign, information such as the objective, campaign details (including names and launch dates), duration in days, impressions generated, traffic source, target audience, and visibility status are displayed. For example, campaigns targeting returning customers through PPC or referrals are shown alongside the number of impressions they generated and whether their visibility was restricted or public. This detailed data allows for side-by-side comparison of campaigns, helping users assess which strategies were most effective in engaging audiences and driving results.
Overall, this dashboard combines high-level categorization with granular campaign-specific insights, making it a powerful tool for evaluating and optimizing marketing strategies. It enables decision-makers to bridge the gap between strategic overviews and actionable details, ensuring a thorough understanding of campaign performance and impact.